Authors: Brishan Kalyan, Levis Sirikwa, Eligio Maure
4.5. Ocean colour and remote sensing#
4.5.1. What is remote sensing?#
Remote sensing refers to the process of detecting and monitoring the physical characteristics of an object without direct contact. It happens by measuring the electromagnetic energy (Figure 4.2) emitted or reflected from a distance. When the Sun is the primary source of energy detected by remote sensors, these types of sensors are denoted passive sensors ({numref}`` Figure 3.5.2). The other type of sensors are called active because they use their own source of energy. An example of active sensors include radio detection and ranging (radar) sensors, altimeters, and scatterometers. In what follows, our discussion revolves around the so-called passive sensors. The majority of these sensors operate in the visible, infrared, thermal infrared, and microwave portions of the electromagnetic spectrum. Unlike active sensors such as microwaves that can see through clouds, passive sensors are hindered by the presence of dense clouds and thus cannot take measurements in areas under cloud cover.
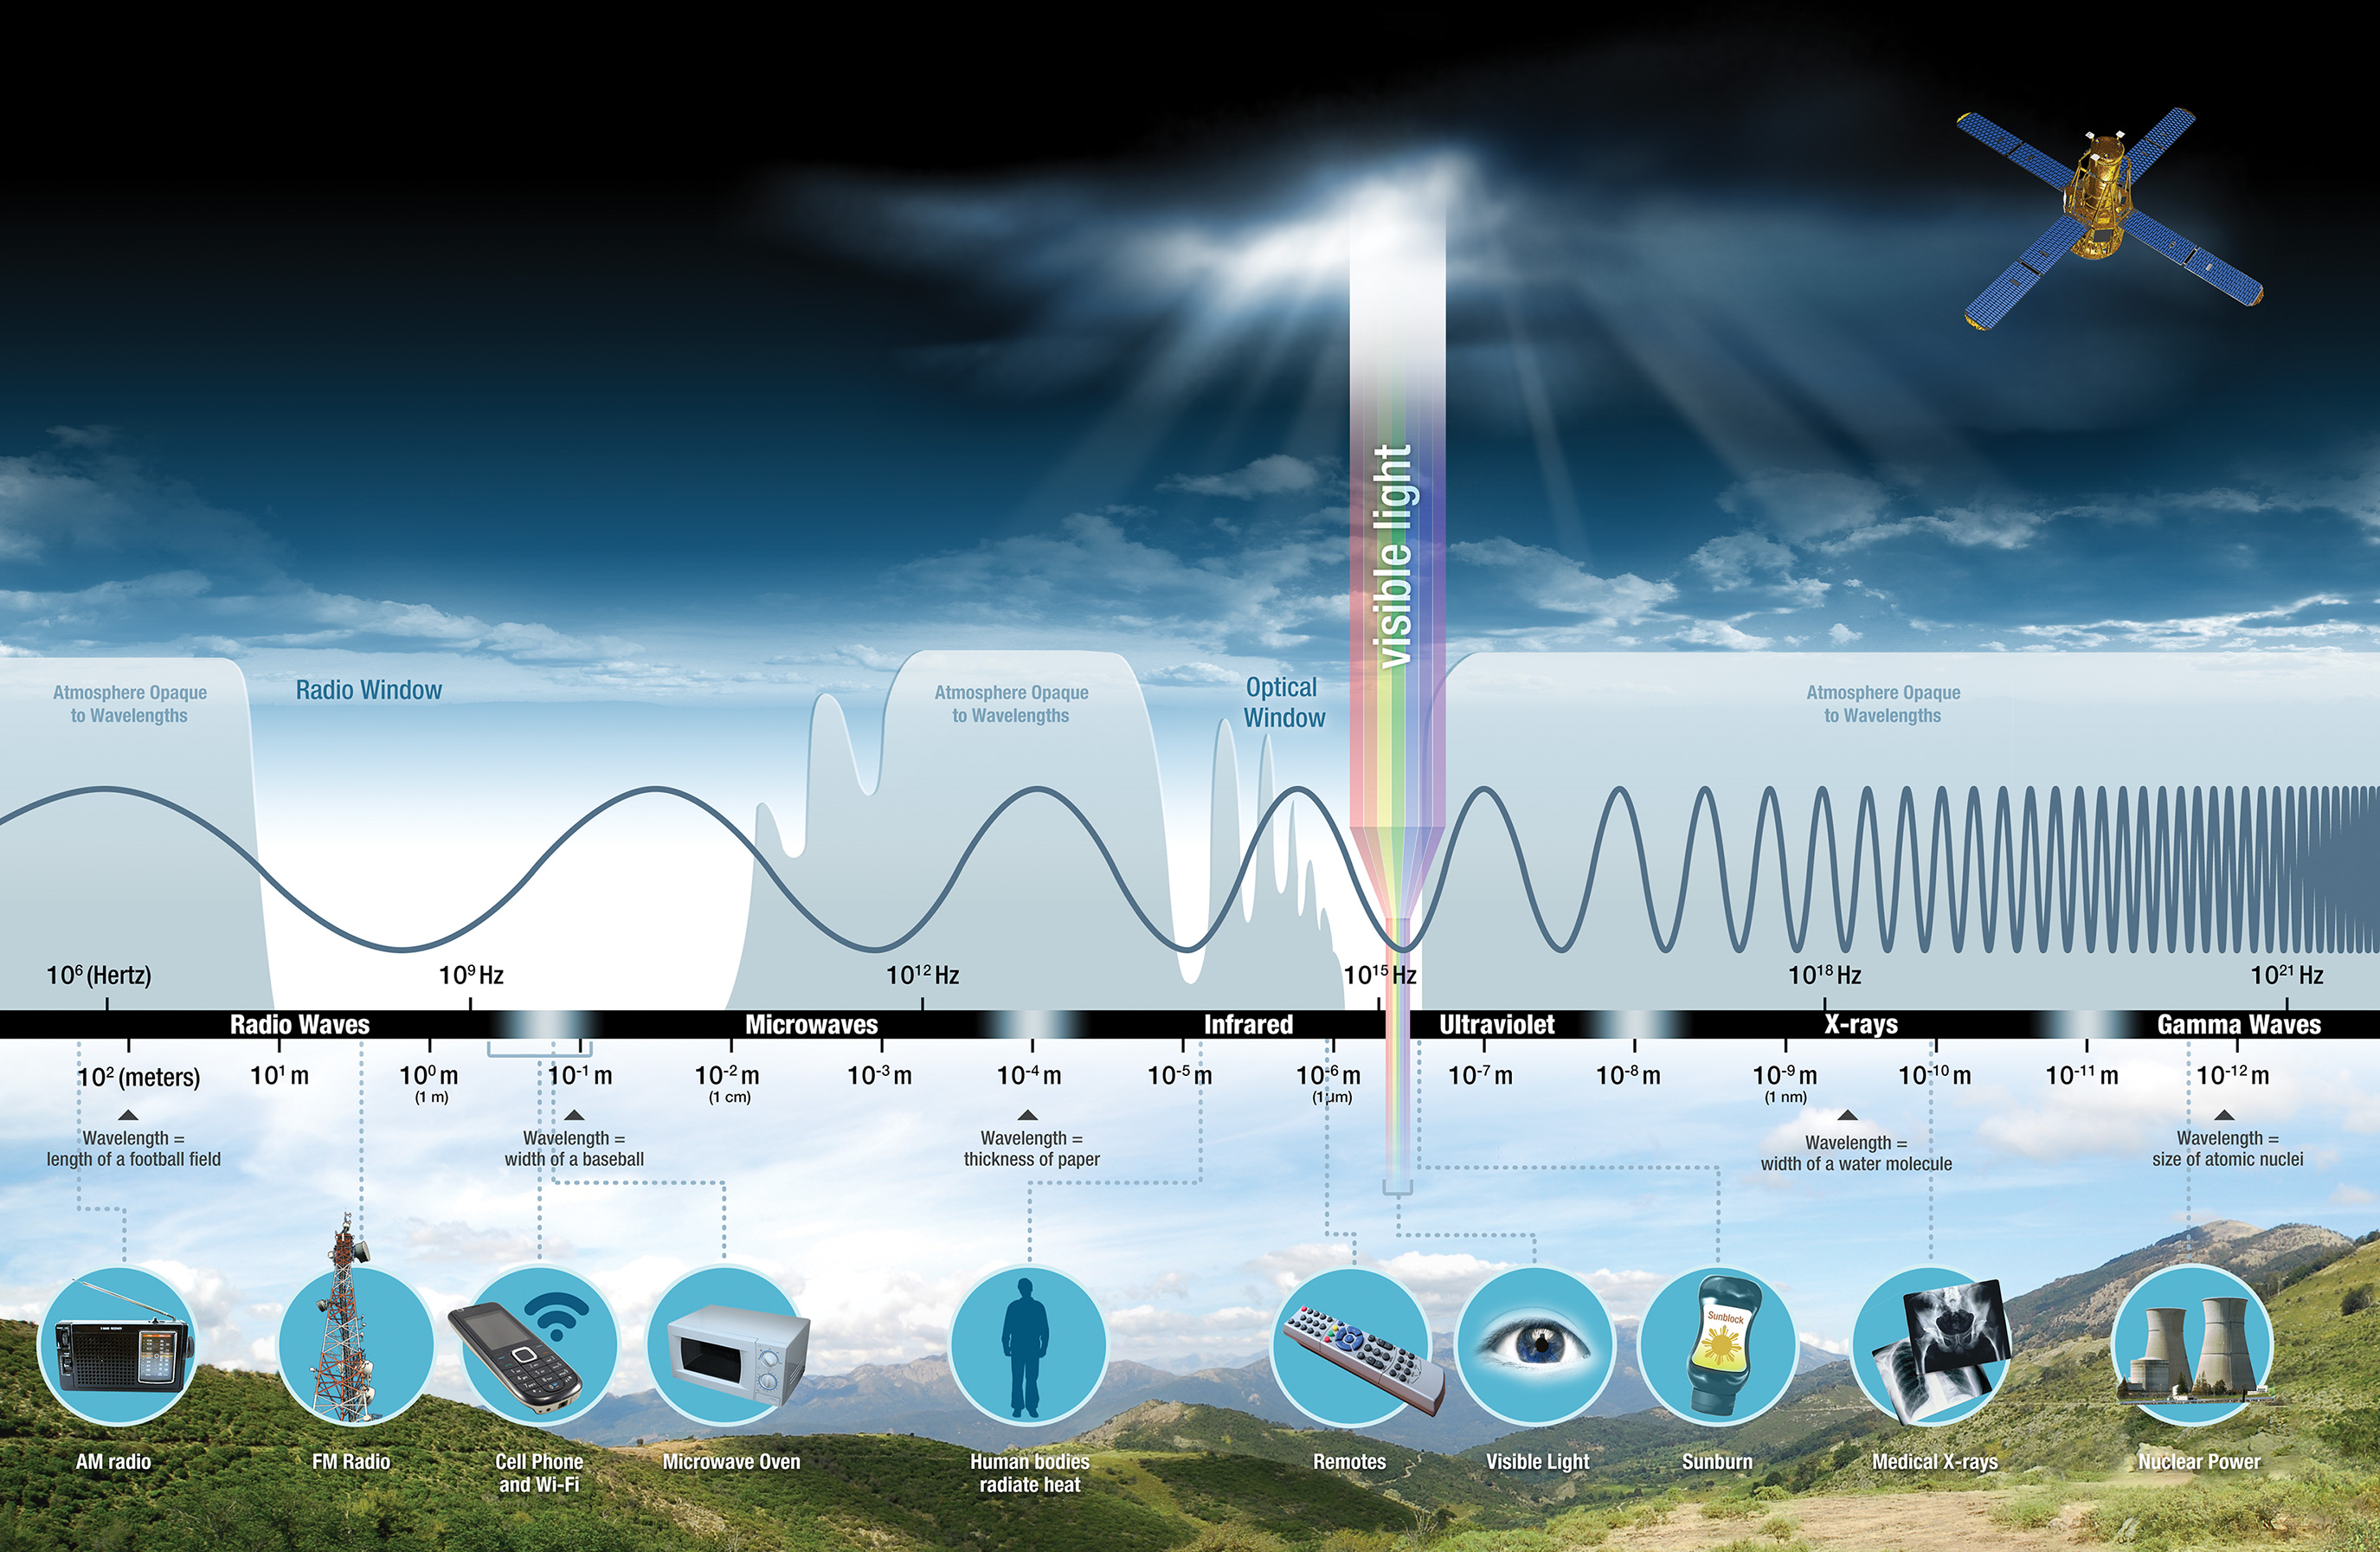
Fig. 4.2 Diagram of the Electromagnetic Spectrum. Source: NASA Science.#
4.5.2. What is ocean colour remote sensing?#
Ocean colour remote sensing refers to the ability to measure, track, and analyse the colour of water bodies from a distance, i.e., space (typically from artificial satellites). The water bodies include the ocean, estuaries, rivers, lakes and wetlands. The specific parameters of interest in the field of ocean colour remote sensing include colour variations, sea surface temperature, winds, and currents among other unique biotic and abiotic factors in water bodies. The main objective of ocean colour remote sensing is to be able to describe the colour of the water bodies as observed from the satellites, understand the state of aquatic ecosystem health, and the dynamics of their productivity (Figure 4.3 and Figure 4.4). The observations made from remote sensing are pegged on the spectrum of water leaving radiance.
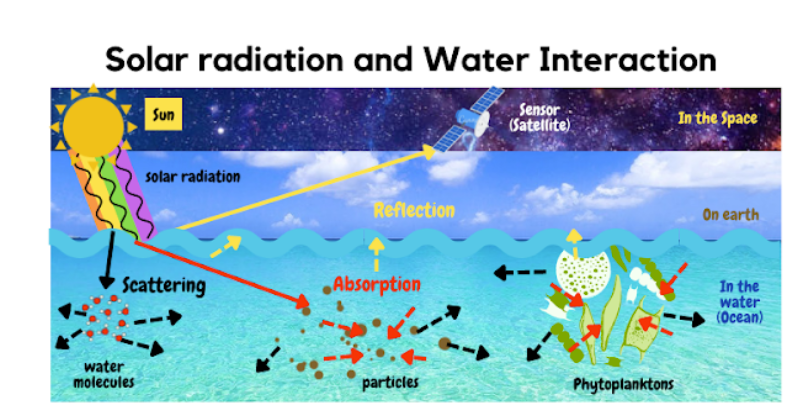
Fig. 4.3 Illustration of what happens when solar radiation hits the water column of the ocean. When the solar radiation reaches the ocean water column, it is either absorbed (red arrows) or scattered (black arrows), or thereafter reflected (yellow arrows) depending on the physical, and biochemical composition of the water. The satellites or sensors capture the reflected radiance, thereafter they are processed into images. Source: Levis Sirikwa.#
The sun produces solar radiations which are directed to the earth surface to maintain life. Infra-red light, ultraviolet light and visible light are the main components of solar radiation. The radiations from the sun to the earth travel in different wavelengths as observed in Figure 4.2. One of the main segments of the solar radiation in ocean colour is the visible light (Figure 4.5).
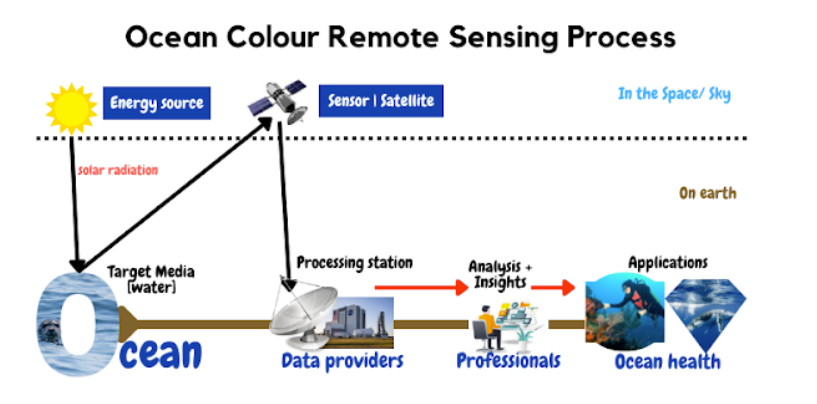
Fig. 4.4 Schematic representation on the concept of ocean colour remote sensing. The sun is the main source of energy since it produces solar radiation directed to the earth. The schematic shows that ocean colour remote sensing is a journey of light from the sun, going through the ocean, having the reflectance captured by the satellite sensors which are processed to form images, and made available by the processing stations such as NASA or JAXA, who are the data providers. Professionals and experts in the field of oceanography acquire the data from the data providers, and use tools like python and other softwares to analyse the data to provide information relevant to inform decisions and aid in the sustainable use of the ocean. Source: Levis Sirikwa.#
According to a report by NASA Science, the visible light spectrum is a segment of the electromagnetic spectrum that the human eye can see. Furthemore, the findings of NASA Science confirm that the human eye can detect wavelengths from 380 nm to 700 nm as demonstrated in Figure 4.5. While the human eye can see the visible light spectrum, the satellites are able to detect other sections of the electromagnetic spectrum such as the Infrared (Figure 4.5), which could provide great insights about the heat budget in the ocean.
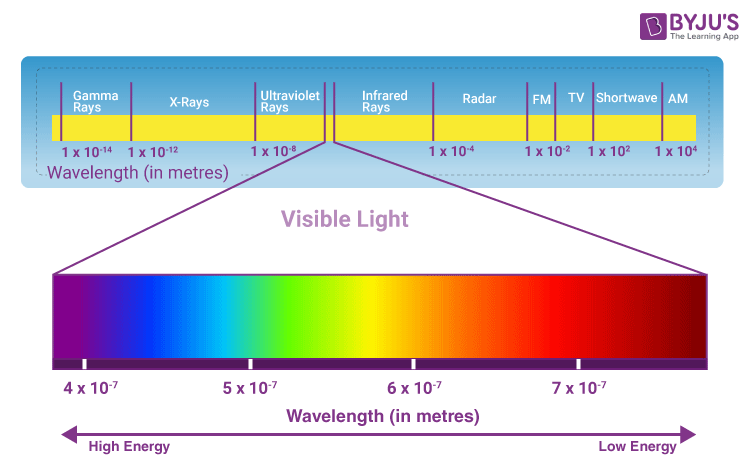
Fig. 4.5 The visible light spectrum and its different wavelengths range from 380 nm (Violet) to 740 nm (Red).This is just a part of the electromagnetic spectrum that can be visualised by a human eye.#
4.5.3. Why do we see blue as the primary colour of the ocean?#
Since what makes colour is the interaction of light with different materials, open ocean waters or clear waters appear blue due to the fact that blue light is the least absorbed by water whilst red light is the most strongly absorbed (Figure 4.6). In coastal areas, runoff from rivers or resuspension of sand and silt from the bottom by tides result in strong absorption of shorter wavelengths (violet and blue), thus turning the ocean colour yellow or brown.
Radiation from the sun plays a vital role in maintaining the colour of the ocean as blue. The red wavelengths of light are absorbed up to about 50 metres deep in the water body. The absorption of the red wavelengths of light leaves blue wavelengths of light which are reflected back out of the water [Groom et al., 2019]. The blue wavelengths of light can penetrate up to depths of 200 metres, this results in the water body being blue. Similarly, water molecules together with tiny particles found in large water bodies readily scatter blue light more than any other colours (Figure 4.3).
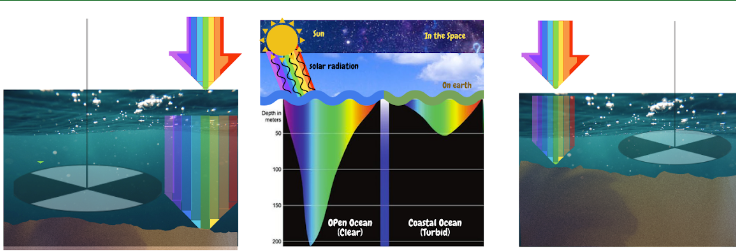
Fig. 4.6 The penetration of visible light spectrum in open ocean versus coastal waters. The figure shows that the depth of sunlight penetration in the coastal ocean is limited due to high turbidity compared with the open ocean which is less turbid. Generally, as observed on the image, the blue, and the green light penetrate deepest, while the red light penetrates least in the water. Designed by: Levis Sirikwa.#
Note
A long time ago, in the 1800s, a British astronomer by the name William Herschel did a small experiment. He measured the differences in temperature between the colors found in the visible spectrum of the electromagnetic radiation. In order to achieve this objective, he placed thermometers in the path of light within each color of the visible spectrum. He found out that there was an increase in temperature from blue to red. Furthermore, upon further investigations, he found the temperature to be warmer just beyond the red end of the visible spectrum. That was the moment infrared radiation was discovered. NASA has acknowledged his finding to date.
4.5.4. What’s the relevance of infrared in ocean colour remote sensing?#
The uniqueness of Infrared radiation such as the longer wavelengths above the visible light spectrum, but shorter than the radio waves, together with varying frequencies allows the radiations to be applied in thermal imaging, heat sensors and night vision scenarios. Although infrared radiation cannot be observed by the human eye, it can be felt as heat. Thermal infrared ranges from 8 to 15 microns (µm) and is best for studying the longwave thermal energy radiating from our planet. Therefore, systems and living organisms on earth which emit heat have a special interaction with infrared radiations. The study of these specific radiations provides a lot of insights about sea surface temperatures (SST), currents and winds (need a reference here).

Fig. 4.7 The position and composition of the infrared spectrum on the electromagnetic spectrum. The infrared spectrum starts from the wavelength of 700 nm to about 500 µm. The composition of the infrared has three main sections which include the Near infrared (NIR, 800 nm to 2500 nm), the Mid infrared (MIR, 2500 nm to 25 µm), and the Far Infrared (FIR, 25 µm to 500 µm) bordering the microwave spectrum. Source: Fox [2020].#
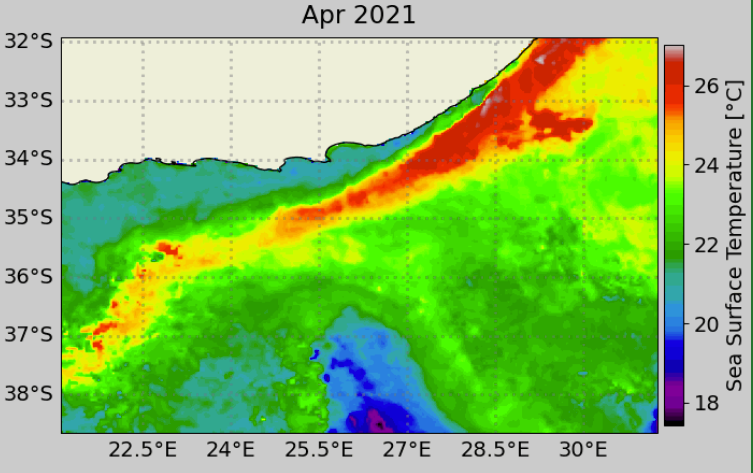
Fig. 4.8 Sea surface temperature as seen by satellite sensors, which capture what the bare eyes cannot see. For instance, the online version of this image–an animation–shows monthly sea surface temperature change off the south coast of South Africa. The Agulhas Current is highlighted in red. Source: Ocean Teacher Global Academy Course 2021 - Module 2 Lesson 1 - data manipulation and analysis - image (animations) - created by Brishan Kalyan.#
